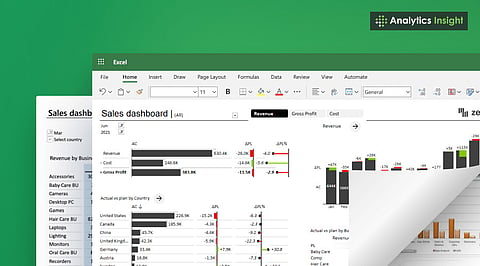

Excel visuals make data easier to understand and present in real projects.
Top online platforms offer beginner to advanced courses for every learner.
Visualization skills increase career opportunities in business and analytics.
Excel is still one of the most widely used tools in schools, offices, and businesses. It helps organize numbers, but its real power shows when those numbers are turned into charts, dashboards, and visuals that tell a story.
Employers want people who can do this well, and online learning has made it easier than ever to pick up these skills. In 2025, several courses stand out for teaching Excel data visualization, from beginner-friendly guides to advanced programs.
Platform: Udemy
This Udemy course is among the most popular choices. Taught by Chris Dutton and Maven Analytics, it covers over 20 types of charts and shows how to build dashboards that update automatically. Real-life examples make the lessons practical for work or school. With strong reviews and recent updates, it remains a top pick.
Platform: Coursera
Offered by Macquarie University, this specialization includes multiple courses. It starts with basic Excel and moves into advanced tools such as pivot tables, dashboard design, and data cleaning. Each section has projects that mirror real workplace challenges, making it valuable for students planning careers in business or analytics.
Also Read: Data Visualization Courses: Mastering Tableau and Power BI
Platform: DataCamp
This short course is focused entirely on visuals. It is project-based, with learners building and customizing charts step by step. Because the lessons are interactive, the course is easy to follow and fits well into short study sessions. It is highly rated and practical for anyone short on time.
Platform: Udemy
Another Udemy bestseller, this course is designed for learners who want variety. It covers advanced visuals such as tornado charts, Gantt charts, and dynamic infographics. It also includes practice projects that help learners think creatively about how to present information.
Platform: LinkedIn Learning
This LinkedIn Learning course focuses on building dashboards. It teaches conditional formatting, layout design, and interactive tools like slicers. Learners can also add the course certificate directly to their LinkedIn profiles, making it appealing to employers.
Platform: edX – Rice University
Offered as part of a professional certificate, this edX course covers data analysis and visualization. Students work with pivot tables and learn to present results using charts and dashboards. It follows a university-style approach, making it ideal for those who like academic teaching.
Platform: Coursera – Macquarie University
This course is part of the “Excel Skills for Business” series on Coursera. It goes into advanced features such as automation, complex formulas, and visualization. By the end, learners can combine analysis with visuals, giving them strong skills for business use.
Platform: GoSkills
GoSkills offers short, modular lessons, and this course is focused on professional dashboards. It teaches how to design clean and interactive visuals. Certificates are included, and the short lessons make it easy to learn even with a busy schedule.
Excel is now more than rows and columns. Charts and dashboards make it easier to show what data really means. A good visualization can point out trends or issues that plain numbers may hide. Employers in fields like finance, marketing, research, and sports value people who can explain data clearly. These skills help students shine in internships, projects, and entry-level jobs.
Also Read: Data Visualization for Data Science: 10 Best Online Courses
The variety of Excel courses in 2025 shows the growing importance of data visualization. Udemy and Coursera provide structured learning paths for different levels. DataCamp and GoSkills focus on shorter, practical lessons. LinkedIn Learning and edX add professional and academic approaches.
Together, these eight courses cover skills ranging from basic chart design to advanced dashboards. For learners aiming to make data clearer and more impactful, these programs serve as some of the best starting points this year.
