
Analyst Crypto Patel posted a two-week Solana chart on X and said SOL had been classified as a commodity while still trading 77% below its all-time high. He pointed to a Fibonacci golden zone that he said was held on the 2W chart. He also connected this setup to Solana's previous 2,194% rebound from its 2022 bottom, stating that a move above $1,000 was inevitable.
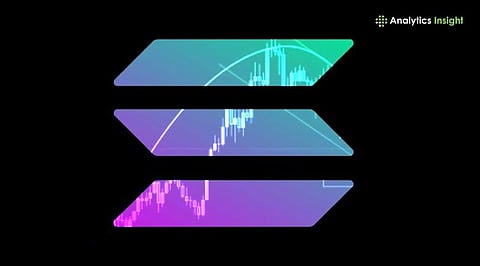
The chart showed SOL/USDT on Binance trading near $79.84 on the two-week timeframe. It also marked a support and accumulation zone between the 0.5 and 0.618 Fibonacci levels. In turn, Patel framed the current structure as a repeatable setup rather than a fresh breakdown.
In his post, Patel compared the current decline with Solana’s collapse to about $8 in 2022. He said many market participants then thought the token was finished.
He followed that comparison with a performance claim from the same chart. According to Patel, Solana later delivered a 2,194% rally from that bottom.
That rally figure also appeared on the chart near the earlier recovery leg. As a result, the post tied the current market structure to a previously recorded move on the same two-week setup.
The chart placed a strong focus on the Fibonacci golden zone. Patel said that zone was holding perfectly on the two-week chart.
Visually, the chart marked the 0.5 level near $61.75 and the 0.618 level near $42.62. Between those levels, a shaded band labeled “Support / Accumulation Zone” defined the key area.
The same image also showed SOL trading below the 0.382 level near $89.48. Even so, Patel treated the current range as a support area rather than a bearish failure.
Could the same structure that once preceded a 2,194% rebound now shape Solana’s next major move?
Also Read: Solana Eyes $85 as SoFi Launch Boosts Network Outlook
Patel’s post ended with a direct price target. He said, “$1,000+ SOL is not a question... It’s just a matter of time.”
The chart supported that message with a projected vertical move from the current zone. That projection showed a potential gain of about 1,870.86% and pointed toward the four-digit area.
At the same time, the upper boundary on the chart showed a target zone near $1,011.70. Therefore, the post connected Solana’s current support test, its past rebound, and the analyst’s $1,000 target within one technical narrative.
Crypto Patel’s chart-based view places Solana in a key Fibonacci golden zone while SOL remains far below its all-time high. The article ties that setup to Solana’s earlier rebound and a possible $1,000 path. The main takeaway is that traders will likely keep watching this support area closely.