
Data analysis software makes sense of large amounts of information quickly.
Tools like R, Python, and SPSS simplify research and statistical studies.
Visualization platforms like Tableau and Power BI make data easy to read.
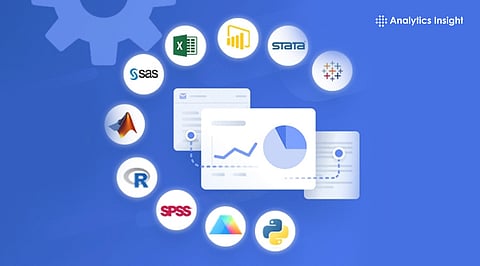
Many organizations across sectors depend on data insights to make important decisions. From improving workflows within the hospitals to tracking climate change and studying markets, data analysis helps make sense of large amounts of information. Experts use special software that can organize, study, and present data clearly to help understand numbers and draw legible insights from them. Below are ten important statistical tools used for data analysis.
R is a popular software used for statistics and research. The platform is free to use and supports many advanced functions. Students and professionals use it to identify trends, create charts, and test ideas. R tools like ggplot2 and tidyverse help make reports and data visualizations that are easier to understand.
Python is one of the most common languages preferred for data workflows. It is simple to learn and can be used for both small and large projects. Libraries like Pandas and NumPy help organize and calculate data, while SciPy supports deep statistical analysis. Python is also compatible with tools like Matplotlib, allowing users to create clean graphs.
SAS is trusted by large companies and government organizations. It helps study large datasets safely and quickly. Many industries use SAS for predicting outcomes such as customer behaviour or financial risks. The latest versions are faster and work smoothly on cloud systems.
IBM SPSS Statistics is known for its simple and easy-to-navigate interface. It is mostly used for education, marketing, and social science research. The platform helps study survey results and understand human behavior. The new version uses artificial intelligence to produce analysis results that are quicker and more accurate.
Also Read: Data Analysis Dilemma: Pandas or Dask? Choose Your Library Wisely
Power BI is used to turn plain data into colourful charts and reports. The tool is popular in offices where teams need to present data insights in meetings or reports in a format that every stakeholder can easily understand. Power BI now supports advanced tools that help in predicting future trends. The platform also works with Python and R to provide better results.
Tableau is one of the best tools for data visualization. It allows users to explore and share data through interactive dashboards. The 2025 version integrates AI and lets users ask data-related questions in simple language and get visual answers. Many companies use Tableau to understand sales, customer habits, and growth patterns.
Minitab is often used in factories and industries to maintain product quality. The tool helps find problems in production and improve performance. The new version supports collaboration through online sharing and gives real-time updates, making it easier for companies to make fast decisions.
Stata is mainly used in economics, public health, and education research. The platform can handle large datasets and perform advanced modeling techniques like regression and time series. The 2025 version includes faster processing and automation, making Stata more useful for detailed research.
Also Read: Data Analysis with Python: Using Pandas, NumPy, and Matplotlib
RapidMiner combines machine learning and statistics in one platform. It helps organizations study data without much coding. Many businesses use RapidMiner to analyze data and predict future trends like market changes or sales performance. It is known for saving time and providing clear results.
JMP is a tool that focuses on exploring data visually. It connects graphs and numbers, helping users find relationships between different factors. The statistical platform is often used in research and product testing. The new version adds better visuals and automated report creation.
Learning data analysis has become very important when most companies depend on information to make crucial decisions. The ten tools explained above make it easier to understand and use data to support claims and suggestions. Software like R, Python, and SPSS help with research, while Power BI and Tableau make data simple to read and share. Knowing how to use these tools gives learners an advantage over others and helps build a sustainable career.
1. What is data analysis, and why is it important today?
Data analysis is examining information to find patterns, helping make smarter decisions across industries.
2. Which software is easiest for beginners to start data analysis?
Python and R are beginner-friendly, with simple coding and lots of tutorials for learning analytics fast.
3. How do visualization tools like Tableau improve data understanding?
They turn complex data into charts and dashboards, making insights clear and actionable for decision-making.
4. Can data analysis predict future trends accurately?
Yes, with tools like SAS, RapidMiner, or Python models, patterns in historical data help forecast outcomes.
5. Are data analysis skills useful for non-technical careers?
Absolutely, knowledge of analytics aids marketing, management, finance, research, and almost every field today.
