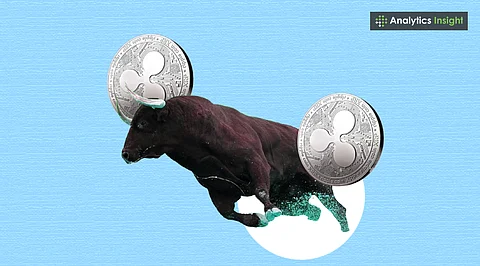

XRP builds bullish momentum around an inverse head-and-shoulders pattern, targeting $2.30+ on a breakout.
Positive derivatives data, rising volume, long-biased funding, and increasing open interest support further upside.
Failure to clear $2.25 resistance could lead to a pullback toward $2.10 - $2.03 support zones.
XRP is approaching a pivotal moment in its price trajectory, hovering just below a crucial resistance level at $2.25. As of July 1, 2025, the token trades around $2.21, reflecting a daily gain of 1.01%. It continues to form a bullish technical pattern supported by rising volume, favorable moving averages, and improving sentiment in the derivatives market.
The market cap for XRP has climbed above $130 billion, and trading volume has surged past $4 billion in the past 24 hours. With both technical and fundamental catalysts aligning, XRP may be preparing for its next significant move.
XRP’s daily chart reveals a market at a pivotal turning point. A well-defined inverse head-and-shoulders pattern is taking shape, often a strong signal of a shift from bearish to bullish momentum.
The neckline of this pattern, currently sitting just below the $2.25 mark, aligns with both horizontal resistance and the 0.382 Fibonacci retracement level at $2.29, adding significant technical weight to this zone.
Price action from mid-May to late June has been confined within a descending parallel channel, characterized by lower highs and lower lows. However, XRP has recently breached the channel’s upper boundary, indicating early signs of trend reversal.
This breakout is bolstered by bullish momentum building from the bottom of the channel near $2.03, a level that aligns with the 0.236 Fib retracement.
A breakout accompanied by increasing volume now visibly rising on green candle days adds further legitimacy to this structure.
XRP’s short-term averages are bullish, supporting a price near $2.18 - $2.21. The mid-term 50 EMA is neutral, while the 100 EMA is stabilizing. The 200 EMA is below the price.
RSI is currently at 52.82, showing a modest bullish bias without being overbought. This gives XRP room to rally without triggering a momentum-based reversal.
Also Read: XRP Price Prediction: What a 50x Surge Could Look Like
Support Levels:
$2.18 - $2.20: Previous consolidation and near the 30-day EMA.
$2.09: A key short-term support aligning with mid-channel structure.
Resistance Levels:
$2.25: Confluence of neckline resistance and Fib level.
$2.30- $2.32: Psychological resistance and prior price pivot.
XRP’s technicals are aligning toward a potential trend reversal, supported by a bullish chart pattern, constructive price structure, and strengthening short-term momentum. The next 24 - 48 hours are crucial if bulls can reclaim and sustain $2.25, the chart opens up to a possible continuation toward $2.30 - $2.50.
Derivatives data from CoinGlass further supports the developing bullish case:
Volume has increased by 196.28%, reaching $7.82 billion, signaling renewed interest from traders.
Open Interest has climbed to $4.37 billion, a 4.96% increase, reflecting more capital entering the market.
Options activity is also picking up, with Options Volume rising by 48.27%.
The Long/Short Ratio across exchanges remains healthy:
A strong close above $2.25 with rising volume could confirm a breakout, targeting $2.30 and potentially $2.51 in the short term.
Bearish Scenario:
Failure to clear $2.25 or a rejection at $2.22 could trigger a pullback toward $2.10 or $2.03, invalidating the bullish setup.
Also Read: XRP Alert: Key Trendline Could Trigger a Major Price Shift
XRP is on the verge of confirming a bullish breakout from a long-standing descending pattern, with volume, structure, and short-term indicators all aligning favorably. Derivatives data supports the bullish case, though the market remains sensitive to sharp moves, as evidenced by recent liquidations.
A decisive break and close above $2.25 with strong volume would likely trigger further upside, potentially toward the $2.30 - $2.50 range. Until then, traders should watch for consolidation, fakeouts, and sudden reversals, especially around key support zones.
For now, the bulls have the upper hand, but they’ll need to follow through with conviction.
1. What is XRP’s immediate resistance level?
Key resistance lies at $2.25, near the neckline of an inverse head-and-shoulders pattern.
2. What price targets are likely if XRP breaks higher?
A confirmed breakout could lead XRP toward $2.30 and potentially $2.50.
3. Why is the derivatives market important now?
Rising volume, open interest, and long/short bias indicate growing bullish conviction.
4. What support levels should traders watch?
Critical support lies at $2.18 - $2.21, followed by $2.09 and $2.03 if momentum fails.
5. Is XRP currently overbought?
No, RSI is at 52.8, indicating balanced momentum with room to rally.