
XRP traded near $1.40 on Binance as an X analyst shared a long-term XRP/USDT chart showing a possible path toward $10. The post pointed to a $1.10-$0.70 accumulation zone and compared current market sentiment with earlier XRP rallies.
The TradingView chart, shared by analyst CryptoPatel on X, showed XRP/USDT on a two-week Binance timeframe. The chart listed XRP at $1.4041, down 1.86%. The analysis marked a long-term target near $10. The chart also displayed a potential move from current levels toward that target, with a labeled gain of about 1,069.57%.
At the same time, the chart showed a downside risk zone. A red projection pointed toward a possible decline of nearly 69.64% before any larger upside move.
That projection aligned with the analyst’s accumulation zone between $1.10 and $0.70. The chart also marked a broader accumulation band below $1.00.
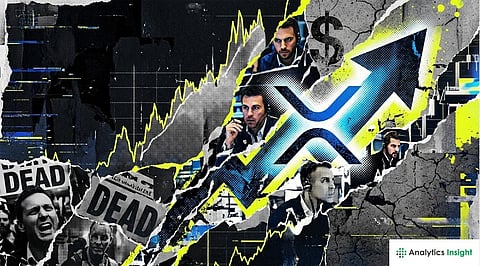
In the X post, the analyst said critics called XRP “dead” in 2023. The post compared that sentiment with XRP’s earlier market moves. The analyst referenced 2017, when XRP traded near $0.006. The post said some market watchers viewed $3 as unrealistic before XRP later climbed above that level in 2018.
The analyst also cited XRP’s move from $0.50 to $2.60 in November 2024. According to the post, that move happened within 30 days.
That comparison framed the current $1.40 level as a key area. The analyst argued that $10 to $20 remains “on the table,” while $100 should not drive market expectations.
Read More: Banks Adopting XRP Ledger: What This Means for XRP Price and Growth
The chart placed a strong focus on the $1.10-$0.70 range. The analyst described that area as an accumulation zone, where smaller purchases may occur. Before that, the chart showed a prior breakout from a long downward trend line. It also marked a past accumulation zone near lower price levels before a sharp rally.
The chart later showed XRP reaching resistance near the $3 region. After that, it marked a breakdown from that resistance area and a return toward lower support.
The analyst pointed to XRP’s technology and adoption in the post. The post claimed XRP is faster than Bitcoin, cheaper than Ethereum, and already used by banks worldwide. Still, the chart centered on price structure rather than short-term news. It showed accumulation, resistance, breakdown, and a projected path toward higher levels.
The analyst’s post framed the current market around patience and positioning. It also kept focus on the $1.10 to $0.70 zone as the key level to watch.
XRP remains near $1.40 as CryptoPatel’s chart points to a $1.10-$0.70 accumulation zone and a possible $10 long-term target. The analysis links today’s setup with earlier XRP rallies, while regulation, sentiment, whales, and adoption remain key market factors to watch.