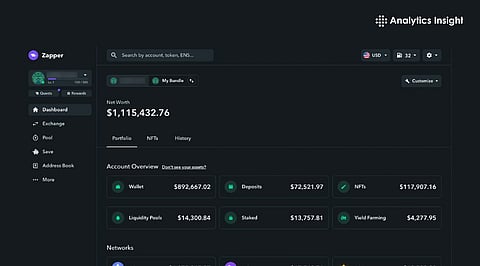

A DeFi dashboard tracks TVL, users, volume, and security data to provide a complete market view.
Real-time alerts help detect risks early during sudden exploits or liquidity drops.
Combining multiple data sources improves accuracy and reduces blind spots.
A DeFi metrics dashboard is a system that collects and shows important data from many decentralized finance protocols in one place. It helps analysts and investors see what is really happening on-chain instead of guessing from price charts alone. Several large-scale security incidents and liquidity shifts proved that watching token prices alone is not enough.
Large protocol losses in January 2026 and bridge exploits later that month showed how fast funds can move when something goes wrong. This emphasizes the need for a dashboard to track both performance and risk data.
The most important metric is Total Value Locked (TVL). TVL indicates the amount of money stored inside DeFi protocols and is a strong signal of trust and activity. TVL changes between Layer 1 and Layer 2 chains in 2026 became more visible as users moved assets to cheaper networks. Swap volume and lending volume are also critical because they show real usage and fee creation.
Active addresses and unique users help measure adoption growth, especially when viewed in weekly and monthly averages. Liquidity depth and price spread data help detect slippage risk. Security indicators such as audit history, exploit reports, and admin key changes must also be tracked because several major exploits in January 2026 happened within only a few hours after abnormal contract behavior.
Also Read - Best DeFi Investment Opportunities for UK Investors
A reliable dashboard uses more than one data source. On-chain analytics platforms provide custom queries for wallet behavior and contract events. Protocol aggregators provide standardized TVL and category comparisons, such as lending, DEX, and derivatives. Security monitoring feeds report suspicious transactions and known hacks.
News signals are also useful to confirm if unusual flows are linked to an exploit or market panic. In late January and early February 2026, multiple aggregator and bridge incidents showed that users can lose millions quickly, which proves that real-time data collection is very important.
The first layer is ingestion, where blockchain nodes or APIs stream raw transaction and contract data. This data then goes into a normalization process where token balances are converted into USD values. Stablecoins and pegged assets must be handled carefully because depegs can distort results.
Storage should be designed for time-series data so trends can be viewed across days and months. Processing systems must handle both scheduled updates and sudden events, such as sharp TVL drops or large wallet outflows. Visualization tools then display this data in charts and tables that are easy to read.
A strong DeFi dashboard not only shows data, but it also reacts to it. Alert systems should trigger when TVL drops suddenly, when large amounts leave a protocol, or when contract permissions change. During the January 2026 exploit wave, protocols lost funds in a short time window, showing the need for automatic warnings.
Risk layers should include approval trackers and wallet flow monitors. When alerts appear, a response process should collect affected addresses, token routes, and possible exit paths to exchanges. This reduces confusion during fast-moving attacks.
The dashboard must show both high-level and deep technical views. Overview sections should display global TVL, 24-hour volume, and active users. Detailed sections should show protocol-level behavior, contract activity, and liquidity pool risks.
Drill-down features allow moving from the chain level to a single smart contract. Data freshness indicators help users know if the numbers are updated or delayed. Confidence scores based on data source reliability can also be added, which improves trust.
Also Read - How US Regulators Are Shaping the Future of DeFi
A DeFi dashboard needs constant updates. Data pipelines should be checked often and compared with other aggregators to flag errors. Changes in protocol logic or token structure must be added to the system. A public record of updates helps maintain transparency. Changes in DeFi activity in 2026 and repeated security events highlight that static dashboards are lacking.
A complete DeFi metrics dashboard combines TVL, volume, user data, and security signals into one system. With the increase of exploits and liquidity movement seen in January and February 2026, tracking risk is now just as important as tracking profit. Such a dashboard gives a clearer picture of the DeFi market and helps reduce blind spots, even during unstable conditions.
1. What is a DeFi metrics dashboard?
A DeFi metrics dashboard is a tool that collects and shows important blockchain data like TVL, volume, and user activity in one place.
2. Why is TVL important for DeFi analysis?
TVL shows how much money is locked inside DeFi protocols and helps measure trust, liquidity, and overall protocol health.
3. How often should a DeFi dashboard update data?
It should update in real time or every few minutes to catch fast changes in price, volume, and security events.
4. Can a DeFi dashboard help with security risks?
Yes, by tracking unusual wallet flows, contract changes, and sudden TVL drops, it can warn users about possible exploits.
5. Do beginners need a DeFi dashboard?
Yes, because it simplifies complex blockchain data and makes market trends easier to understand for new users.