
As data platforms continue to scale, one of the persistent challenges for organizations is not the lack of data, but the ability to interpret how that data behaves over time.
Most enterprise environments already capture detailed metrics across systems, datasets, and workloads. However, understanding trends, identifying pattern shifts, and distinguishing between expected and anomalous behavior often requires separate analytical workflows or data science expertise.
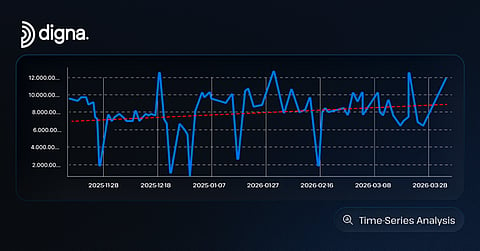
With the release of version 2026.04, digna extends its Data Quality & Observability Platform by introducing built-in time-series analytics designed to make this type of analysis directly accessible within the data environment.
Traditionally, time-series analysis has been performed outside of operational systems, using statistical libraries, notebooks, or external tools. This separation introduces friction, particularly for teams that need to investigate data behavior quickly.
The new analytics functionality integrates time-series methods directly into the platform, allowing users to analyze datasets without exporting data or building custom workflows.
The release includes support for:
linear, quadratic, and cubic regression
piecewise regression with configurable breakpoints
smoothing techniques
quantile analysis
residual analysis
In addition, the platform automatically generates time-series representations for datasets, enabling continuous monitoring of how data evolves.
A key limitation of traditional data monitoring approaches is their reliance on predefined rules.
While rule-based validation is effective for known conditions, it does not scale well in environments where data structures, volumes, and usage patterns are constantly evolving.
By incorporating time-series analysis directly into monitoring workflows, the platform enables a shift toward behavioral analysis. Instead of evaluating data against fixed thresholds, systems can assess whether observed patterns align with expected behavior.
This approach improves the detection of:
gradual drift[Text Wrapping Break]
pattern changes[Text Wrapping Break]
structural shifts in data[Text Wrapping Break]
In many datasets, variation is not random but follows recurring patterns.
Many areas such as finance, retail, and operational systems, exhibit cyclical behavior (seasonality) or fluctuations on a recurring basis. Failure to properly model these trends can result either in monitoring systems generating too much noise or being unable to detect important changes.
By developing additional analytic capabilities that allow for automated identification of trends, seasonal cycles, and changes in patterns, we provide some of the contextual information that often does not exist in static monitoring approaches.
In parallel with analytics enhancements, the release introduces improvements in data validation through reusable components.
Through the use of centralized enumerations, organizations are able to establish standards for the accepted values throughout various data sets. They will also be able to use validation rule templates that can be applied consistently to more than one source for validating purposes.
The validation checks can be run directly in the source database, which reduces data movement and enables validation in a distributed environment to be performed at scale.
Finally, another addition to the system is a capability to have users define conditions which indicate how relevant a metric will be when analyzing anomalies (i.e., metrics that are statistically relevant). This feature also reduces the amount of noise by filtering out anomalies that do not meet the user's defined criteria, so that the monitoring systems can concentrate on deviations which are meaningful.
The increasing complexity of data environments has resulted in a growing disconnect between how much data there is available to work with and how well users understand that data.
Integrated time-series analytics represent an example of a broader trend to make advanced analytical techniques more widely available by integrating the functionality into the existing platform directly rather than relying on external workflows to achieve comparable results and thereby allowing for quicker and more relative context-driven analysis of historical data behavior.