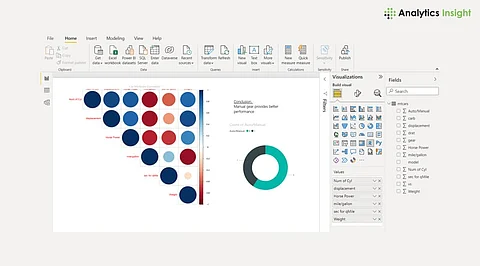

In the dynamic world of cryptocurrency trading, accurate predictions are crucial for making informed investment decisions. By leveraging the combined capabilities of R programming and Power BI, users can create powerful visualizations that enhance their predictive analytics and drive strategic insights. In this article, we will explore how to create and use R visuals for prediction in Power BI effectively.
Power BI allows users to incorporate R scripts directly into their data models, enabling advanced analytics and visualization capabilities. To begin, ensure that the R scripting feature is enabled in Power BI Desktop. Users can then write custom R scripts to perform complex calculations, statistical analyses, and predictive modeling on cryptocurrency data within Power BI.
Before creating predictive models, it is essential to prepare and clean the cryptocurrency data. This involves handling missing values, normalizing data, and selecting relevant features for analysis. Power BI's data transformation tools can assist in these tasks, ensuring that the data is structured appropriately for predictive modeling.
Utilizing R scripts in Power BI, users can develop predictive models using algorithms such as linear regression, time series forecasting, or machine learning techniques like random forests or neural networks. These models can help predict cryptocurrency prices, trends, or market behavior based on historical data and relevant indicators.
Once the predictive models are built using R scripts in Power BI, users can create visually appealing and interactive charts to display the predictions effectively. R visuals offer a wide range of customization options, allowing users to tailor the visualizations to their specific needs and preferences.
For cryptocurrency predictions, time series forecasting is a valuable technique that leverages historical price data to predict future trends. By utilizing R scripts in Power BI, users can apply time series forecasting algorithms like ARIMA (Autoregressive Integrated Moving Average) or exponential smoothing to generate accurate predictions for cryptocurrency prices.
In addition to price predictions, sentiment analysis can provide valuable insights into market sentiment and investor behavior. By analyzing social media feeds, news articles, or forum discussions related to cryptocurrencies, users can gauge public sentiment and incorporate this information into their predictive models using R scripts in Power BI.
Power BI offers real-time data streaming capabilities that enable users to visualize live cryptocurrency data and predictions as they unfold. By connecting Power BI to real-time data sources like APIs or streaming platforms, users can create dynamic dashboards that update in real-time with the latest cryptocurrency information and predictions generated by R scripts.
Interactive dashboards are a powerful tool for exploring cryptocurrency predictions visually and gaining deeper insights into market trends. With Power BI's interactive features and R visuals, users can drill down into specific data points, filter information dynamically, and uncover hidden patterns within cryptocurrency data.
Monitoring the performance of predictive models is essential for ensuring their accuracy and reliability over time. By incorporating performance metrics like Mean Absolute Error (MAE) or Root Mean Squared Error (RMSE) into Power BI dashboards using R visuals, users can track model performance and adjust as needed to improve prediction accuracy.
Power BI enables users to collaborate on cryptocurrency predictions by sharing interactive dashboards with team members or stakeholders. By publishing reports to the Power BI service or embedding them in other applications, users can disseminate insights derived from R visuals across their organization effectively.
Combining the analytical power of R programming with the visualization capabilities of Power BI offers a robust solution for creating and utilizing cryptocurrency predictions effectively. By following these steps and leveraging advanced analytics techniques within Power BI's intuitive interface, users can unlock valuable insights from cryptocurrency data and make informed decisions based on accurate predictions generated by R scripts.
Join our WhatsApp Channel to get the latest news, exclusives and videos on WhatsApp
_____________
Disclaimer: Analytics Insight does not provide financial advice or guidance on cryptocurrencies and stocks. Also note that the cryptocurrencies mentioned/listed on the website could potentially be scams, i.e. designed to induce you to invest financial resources that may be lost forever and not be recoverable once investments are made. This article is provided for informational purposes and does not constitute investment advice. You are responsible for conducting your own research (DYOR) before making any investments. Read more about the financial risks involved here.
