
Gold prices in XAUUSD are highly volatile, moving around $5,000 with sharp short-term swings.
Understanding charts like candlesticks and using simple tools helps in reading market direction clearly.
Interest rates, dollar strength, and global events are the main drivers behind gold price movements.
The XAUUSD pair shows the price of gold in US dollars. It is one of the most-watched markets in the world because gold is seen as a safe and valuable asset. As of March 2026, gold prices are highly volatile, with prices edging close to $5,000 per ounce. The precious metal has recently moved between about $4,996 and $5,380 during a short trading window. This shows that the market is active and sometimes unstable.
Gold charts help understand how the price moves over time. These charts reflect market trends. The candlestick chart is the most commonly used method, where each candle lists the opening price, the highest and lowest trading prices, and the closing price.
If the candle moves upward, it means buyers are stronger. If it inches downward, it means sellers are in control. When many candles are seen together, they form patterns. These patterns help predict future prices.
Charts can be short or long. Small time charts show quick changes, while daily or weekly charts show the bigger picture. Gold has shown strong growth in the past year, with gains of more than 70% in some periods. This suggests that the long-term trend has been mostly upward, despite short-term drops.
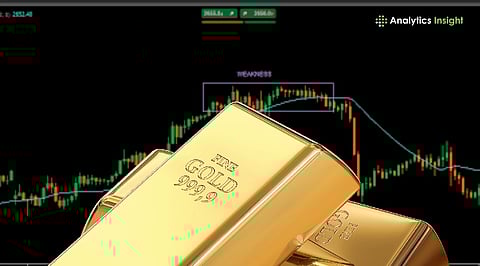
Some simple tools, like moving average are used to understand charts better. The moving average shows the average price of gold over time and helps view the market’s overall direction. When gold stays above this line, the trend is usually strong. If it drops below, the trend may be weak.
RSI is another tool that shows if gold is overbought or oversold. Recently, RSI has been on the lower end, suggesting the slowdown of strong upward momentum.
Fibonacci levels are also used to identify important price areas. These levels show where the price may stop falling or rising. Traders usually watch these zones closely.
Also Read - Gold, Silver Prices Jump in India; Chennai Tops Metro Rates
Gold prices move in trends. A rising trend usually occurs when demand is strong. Gold has recently been in a strong rising trend and even crossed $5,500 per ounce before pulling back.
A falling trend means prices keep dropping. This can happen when interest rates edge higher or when the US dollar becomes stronger. A sideways trend suggests that the market is unsure and moves within a small range.
Support and resistance are also important concepts. Support is a level where price stops falling and starts rising. Resistance is where the price stops rising and starts falling. These levels help in understanding market behavior.
Gold prices have recently slipped to their lowest levels in several weeks. This drop is mainly because the US dollar has become stronger and bond yields have increased. When interest rates go up, gold becomes less attractive since it does not yield interest.
There is also a change in gold’s behavior. Instead of always acting like a safe asset, it is now reacting more to interest rate changes. Even with tensions in the Middle East, prices have not surged as expected. This shows that many factors are simultaneously affecting the market.
In India, gold prices have also dropped, following the global trend. Buyers are being careful, and demand has decreased slightly. The main factors affecting gold right now are interest rates, the strength of the US dollar, global tensions, and inflation. All these forces are working together and causing price changes.
Also Read - Is it a Good Time to Invest in Gold as Prices Rise? Pros and Risks
Gold trading in XAUUSD is influenced by many things. Charts help in understanding price movement, while global news explains why prices move. The market is currently very active, with both rises and drops happening quickly.
Even though gold has shown strong growth over time, short-term changes are common. A clear understanding of charts and trends makes it easier to follow the market and understand its direction.
What is XAUUSD?
XAUUSD shows the price of gold in US dollars and is widely used in global trading markets.
Why are gold prices changing so fast?
Prices are moving quickly due to interest rate changes, a strong dollar, and global economic uncertainty.
Which chart is best for gold trading?
Candlestick charts are the most useful as they clearly show price movement and market sentiment.
Does the US dollar affect gold prices?
Yes, a stronger dollar usually pushes gold prices down, while a weaker dollar supports higher gold prices.
Is gold in an uptrend now?
Gold has shown strong long-term growth, but short-term movements are currently mixed with some corrections.