.png)

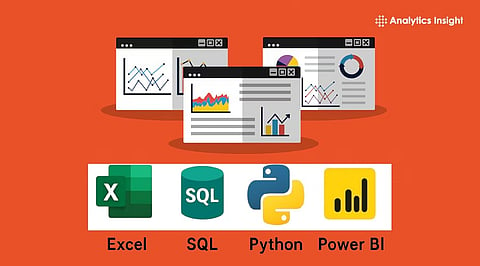
Excel remains one of the most widely used tools for everyday data analysis.
SQL helps find and manage data stored in databases with ease.
Python and Power BI support advanced analysis, automation, and interactive reports.
Data analytics means studying data to find useful information. Every company collects large volumes of data every day. This includes sales figures, customer reviews, website traffic, and business growth.
Companies utilize these data points to make better decisions and plan for the future. Data analytics is one of the most useful skills, and companies want employees who know more than one tool. Excel, SQL, Python, and Power BI are the four most popular tools in this field.
Each tool has a different purpose. Excel helps with calculations, SQL finds data from databases, Power BI turns data into easy-to-read charts and reports, and Python works with large amounts of data and solves complex problems. This guide provides an easy-to-follow cheat sheet with all the important formulas, commands, and functions in one place.
Also Read - PyCharm vs VS Code: Which One is Better for Python Development?
Excel is one of the most common tools for data analytics. It is easy to use and works well for daily tasks. Many companies use Excel to make reports, study numbers, and organize data.
Some of the most useful Excel formulas are SUM, AVERAGE, COUNT, MIN, and MAX. These formulas help find totals, averages, the number of values, the smallest value, and the largest value. IF helps compare values and gives different results based on a condition. XLOOKUP and VLOOKUP help find information from large tables. INDEX and MATCH also help find data in a better way.
Excel also has useful features like Pivot Tables, which turn large tables into simple reports. Conditional Formatting changes cell colors to show important values. Power Query cleans data before analysis. Data Validation helps stop mistakes when people enter data.
Even today, Excel is still one of the most popular analytics tools. Recent industry surveys show that more than 75% of data professionals use Excel in their daily work.
SQL stands for Structured Query Language. It helps people work with databases. Almost every company stores important business data in a database. SQL helps find the right data in a fast and easy way.
The most common SQL commands are SELECT, FROM, WHERE, ORDER BY, GROUP BY, HAVING, DISTINCT, and LIMIT. These commands help search data, filter results, sort information, and create summaries.
SQL also joins data from different tables. INNER JOIN shows matching data from two tables. LEFT JOIN shows all records from the first table. RIGHT JOIN shows all records from the second table. FULL OUTER JOIN shows records from both tables.
SQL also has advanced features like Common Table Expressions, CASE statements, subqueries, Window Functions, ROW_NUMBER, RANK, DENSE_RANK, LEAD, and LAG. These features help solve bigger data problems. SQL is one of the most important skills, as most business data lies within databases.
Also Read - How Do Algorithms Work? A Beginner’s Guide to Understanding Algorithms in 2026
Python is a programming language used for data analysis. It is easy to learn and helps analyze and work with big data. Many enterprises prefer Python as it is time-efficient and easy to implement.
Pandas, NumPy, Matplotlib, Plotly, and Scikit-learn are the five most popular Python libraries. Pandas is used to work with databases and tables. NumPy is mainly responsible for performing mathematical operations. Matplotlib and Plotly can be used to visualize datasets. Scikit-learn helps develop machine-learning models.
Pandas also includes a number of commands including read_csv(), head(), info(), describe(), shape, columns, groupby(), merge(), sort_values(), drop_duplicates(), and fillna(). The given commands allow opening and reviewing files, studying the data available in the database, merging two tables, eliminating redundant records, and correcting missing information.
Finally, Python provides useful features for data cleansing, automation, statistical analysis, machine learning, and artificial intelligence.
Power BI is a business intelligence tool from Microsoft. It changes raw data into simple charts, reports, and dashboards. These reports help companies understand data quickly and make better business decisions.
The main parts of Power BI are Power Query, Data Model, DAX, Visualizations, Dashboards, and Power BI Service. Power Query prepares data before analysis. The Data Model connects different tables. DAX creates formulas and calculations.
Power BI has many chart types. These include bar charts, line charts, column charts, pie charts, maps, KPI cards, matrix tables, and slicers. These charts make data easy to understand.
Microsoft says that Power BI is now used by more than 375,000 organizations around the world. It also has more than 30 million monthly active users. These numbers show how popular the platform has become.
Data analytics changes as new technology arrives. Artificial intelligence now helps people study data much faster. Many tools can answer business questions with simple text instead of lengthy code. Cloud technology also makes it easy to store and study large amounts of data.
Real-time reports have become more common because companies want the latest information at any time. Better data security and simple self-service tools have also become more important. Industry experts say that AI-powered analytics, better data governance, and easy access to business intelligence are the biggest data analytics trends.
A complete data analytics cheat sheet saves time and makes work easier. Excel helps with numbers and reports. SQL finds data from databases. Python handles large datasets and advanced analysis. Power BI creates clear charts and dashboards. Together, these four tools cover every important part of data analytics. Learning them builds a strong base for a successful career in today's data-driven world.
1. What is a data analytics cheat sheet?
A data analytics cheat sheet is a quick reference guide that includes important formulas, commands, and functions for popular analytics tools.
2. Why is Excel important for data analytics?
Excel helps organize data, perform calculations, create reports, and study trends with simple formulas and built-in features.
3. Why should SQL be part of data analytics skills?
SQL helps access, filter, and analyze data stored in databases, which most businesses use every day.
4. What is Python used for in data analytics?
Python helps clean data, automate tasks, create charts, perform statistical analysis, and build machine learning models.
5. Why do companies use Power BI?
Power BI turns raw data into clear dashboards and reports, which help businesses understand information and make better decisions.
